Today, LiDAR is a normal part of how we approach difficult sites at Camber. In 2023, it definitely wasn’t.
Our first real reason to use it came from a residential project unlike anything we had worked on before. The house was a striking mid-century modern home built into the side of a bluff. An in-ground pool and pool house stepped down the hillside below it, and years of abandonment had left the property in serious disrepair.
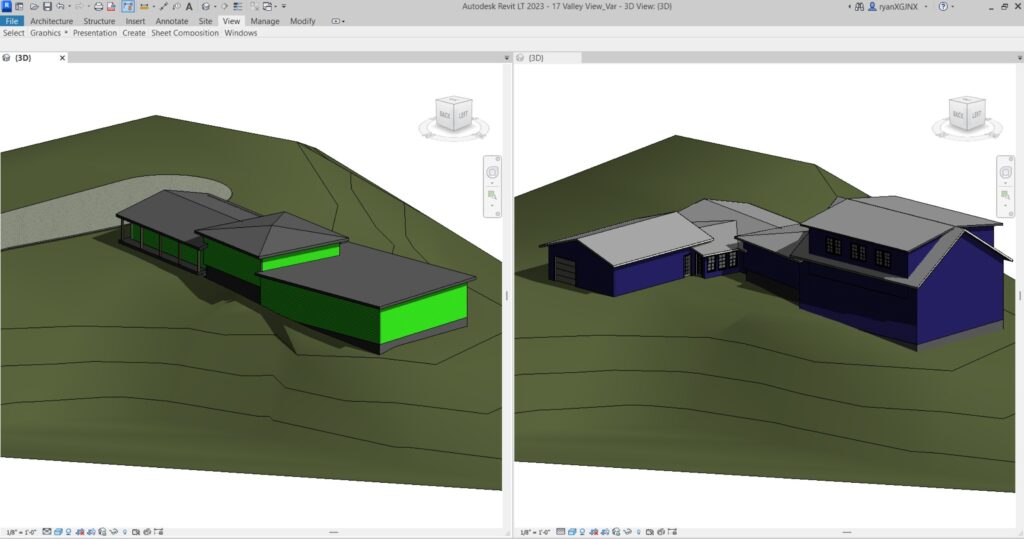
The new owner saw what it could become.
The plans included bringing the house back to life, adding new living space above the pool house, and building a massive garage for business equipment.
That garage created a problem.
The site moved dramatically in every direction. Getting the building placement and slopes right meant understanding far more than we could comfortably learn from a handful of measurements on the ground.
We needed a better picture of the land. We set out to find one… and we stumbled upon open source LiDAR.
We needed a better picture of the land. We set out to find one, and stumbled onto publicly available LiDAR data. LiDAR is a laser-based way of measuring the shape of the ground in remarkable detail. Instead of a few elevation points, you can work with millions of them. The dataset we used was published by the University of Illinois. It’s cool, check it out (but come back and finish reading…) https://go.illinois.edu/lidar
So naturally, I picked the easiest possible terrain to practice on: Starved Rock State Park …Not really.
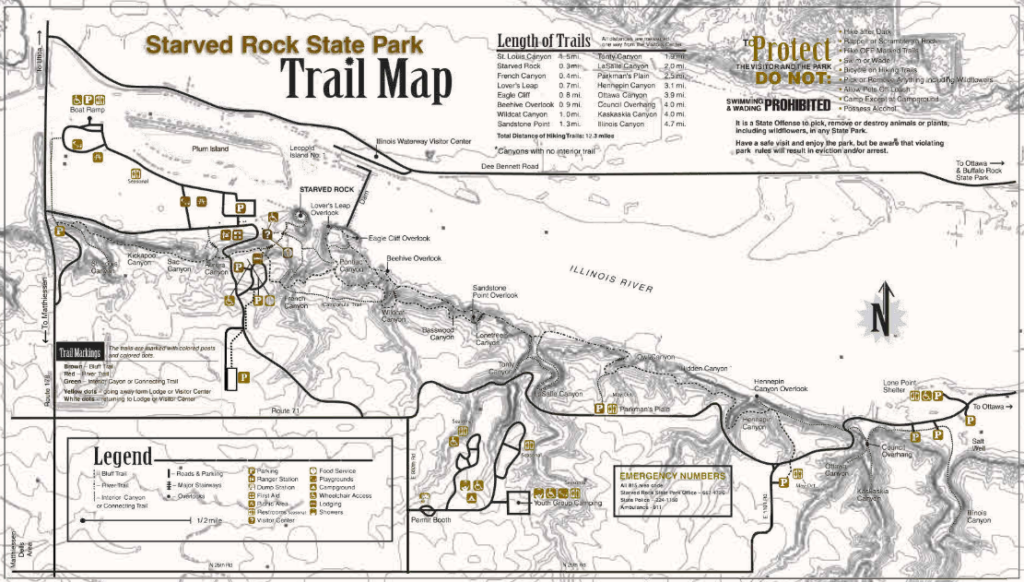
If the goal was to learn terrain, I wanted something that would fight back. Starved Rock gave us cliffs, canyons, ravines, ridges, riverbanks and dramatic changes in elevation packed into one familiar place.
I started pulling apart the available LiDAR data and figuring out how to turn millions of points into something a designer could actually use.
From Points to a Map
The first goal was simple: make the terrain readable.
We separated the ground from everything above it, generated contours, experimented with different levels of detail and slowly built a topographic model of Starved Rock.
The result was the map you see here.
It is very much a 2023 Camber deliverable. The graphics have evolved quite a bit since then.
But the information underneath it was the breakthrough.
Suddenly the canyons, bluff edges and elevation changes we had experienced on foot were measurable. Familiar pieces of the park began to make sense as one connected landscape.
Seeing the Lodge in Context
Contours tell you where the land moves. A 3D model lets you actually feel it.
Moving around the lodge was one of the moments when the experiment started to click. Instead of looking at isolated elevations, we could see the building, surrounding roads and terrain as parts of the same site.
Comparing It to Something Familiar
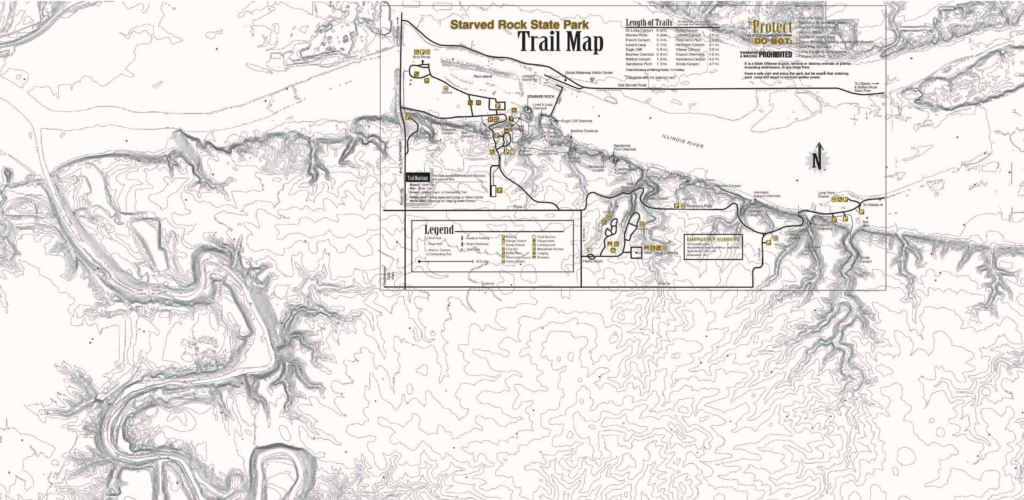
We also brought in the public trail map published by the State of Illinois and overlaid it on the terrain.
Trails we knew suddenly had a reason for bending where they did. Canyons lined up with the contour patterns. Overlooks sat where the terrain said they should.
It was an experiment, but it was also exactly the kind of problem-solving we needed.
Behind all of those contours was the raw LiDAR point cloud: an enormous collection of individual measurements that had to be filtered, cleaned and turned into useful information.
Taking millions of data points and turning them into topographic contours, then into usable terrain inside our drafting environment, felt almost impossible in 2023. This was before AI became part of the workflow and before our architectural software had a built-in “LiDAR” button like it does today.
From Experiment to Everyday Tool
What started with one difficult residential project eventually became part of how we work.
Today, when a site has a bluff, a walkout basement, unusual drainage, difficult access or simply enough elevation change that it is hard to understand from the ground, LiDAR gives us another way to look at it.
It helps us understand the site earlier.
It helps us make better decisions about building placement, slopes and access.
And it reduces the amount of guessing we have to do before a project reaches construction.
The software is better now. Our process is better. The deliverables definitely look better.
But the idea that came out of that home-office experiment is still the same:
The better we understand what is already there, the better we can design what comes next.
Enter Your Email And We’ll Send You A High Resolution PDF Of This Map